Using a Google Earth View as a Background Layer to Draw a Model
Google Earth images generally do not possess the accuracy of engineering drawings. However, in some cases, a user can create a background image (as a jpg or bmp file) and draw a model on that image. In general this model will not be to scale and the user must then enter pipe lengths using user defined lengths.
There is an approach that can be used to draw a roughly scaled model in the stand alone platform without the need to employ user define lengths which can be fairly time consuming. The steps are given below:
- Open the Google Earth image and zoom to the extents that will be used for the model. Make certain that the view is vertical straight down (not tilted). Using Tools > Ruler, draw a straight line with a known length (in an inconspicuous part of the image). Usually a 1000 ft is a good length as shown below:
- Save the image using File > Save > Save Image and assign the image a file name.
- Open WaterGEMS and create a new hydraulic model.
- Import the file as a background using View > Background > New > New File. Browse to the image file and pick Open.
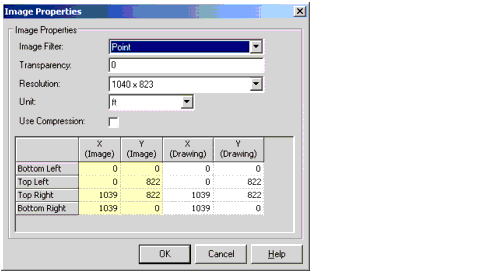
- You will see the default image properties for this drawing. Write down the values in the first two columns of the lower pane and Select OK.
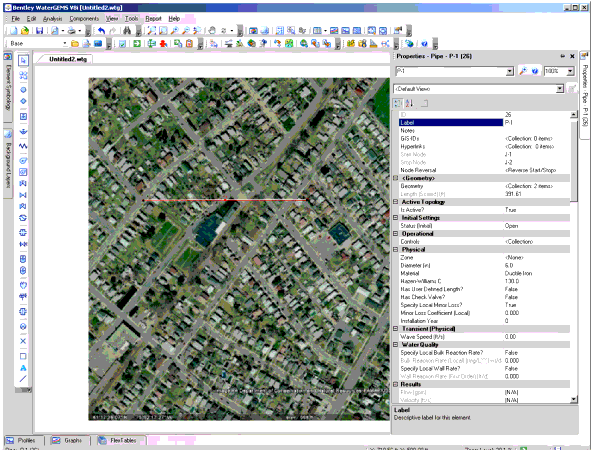
- The background file will open in the model with the scale line showing. Zoom to that scaled line. Draw a pipe as close the exact length as the scale line as possible. Look at the Length (scaled) property of that line. (In this example it is 391.61 ft.) This means that the background needs to be scaled by a factor of 1000/391.61 = 2.553.
- Close the background image by selecting View > Background > Delete and Yes. Delete the pipe and any end nodes.
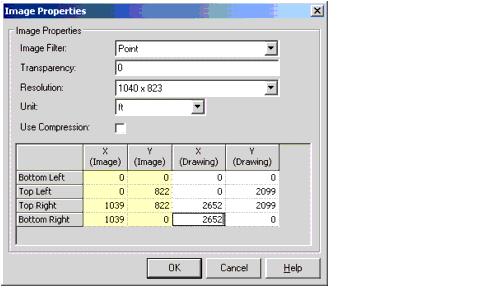
- Reopen the background image using View > Background > New > New File. This time do not accept the default scale. Instead multiply the values in the two rightmost (image) columns by the scale factor determined in step 6 to obtain the values in the two leftmost columns (drawing). For example, the scale factor was (2.553) to the Y value for the top left corner becomes 822 x 2.553 = 2099. Fill in all the image values.
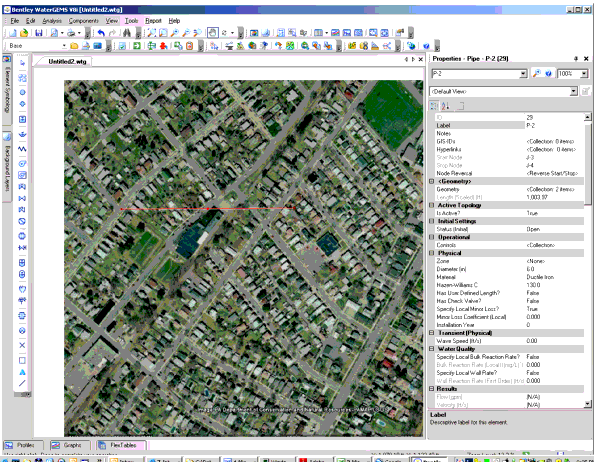
- The image will appear at the correct (approximate) scale. This can be checked by drawing a pipe on top of the scale line in the background image. The Length (scaled) of the pipe should be nearly the same as the length of the scale line. Delete than line and any nodes at the end points.
- The model is now roughly scaled. Remember that the lengths determined this way are not survey accuracy and are as accurate as the care involved in measuring lengths. They may be off by a few percent which may be acceptable for some applications.